A common technique used in the games industry to analyse the state of a game in development and look for where improvements can be made is to capture a frame(all the GPU work being done between each frame being shown to the user) from the game and analyse the results to see the impact of the different elements on the screen and how they might be able to be rearranged.
In doing this we can look at the relative costs of the different aspects of the processes in the scene. An example of this would be that the programmer suspects that the newly implemented bloom post-effect has had too big an impact on performance. So the programmer grabs a few frames from the game and looks at the time that is being taken to perform that effect at different places in the game, and what the cost of that is relative to the rest of the scene.
Another use for this approach is for new programmers coming onto a complex project to get a quick look at the rendering 'pipeline' that has been implemented. As in, what is rendered when, by what shader and in what order. This is quite useful for someone who only needs to make a minor change on a project.
An interesting side-effect of this is that we are able to frame-capture fully finished games and look at what the code is asking our computer to do and from that derive how the rendering system of that game works to some extent.
In this post we will be looking at Europa Universalis 4(EU4) frame captures and constructing a flow chart of how that game is rendered. EU4 is the forth game in the Europa series from Paradox Interactive released in 2013.
To capture frames from the game we will be using Intel's GPA. GPA is one of the simpler and less detailed frame capturing tools available but is good enough for this example and will allow someone with GPU to be able to follow along if they wish.
(For those interested in more complex capture tools the most popular amongst those I know in industry is RenderDoc, but AMD and NVidia each have there own tools which provide specific functionality for features of their cards in Radeon GPU Profiler and NVIDIA NSight respectively. Microsoft also have a tool called PIX but I haven't personally used that in some time but have heard it works with AMDs tools now.)
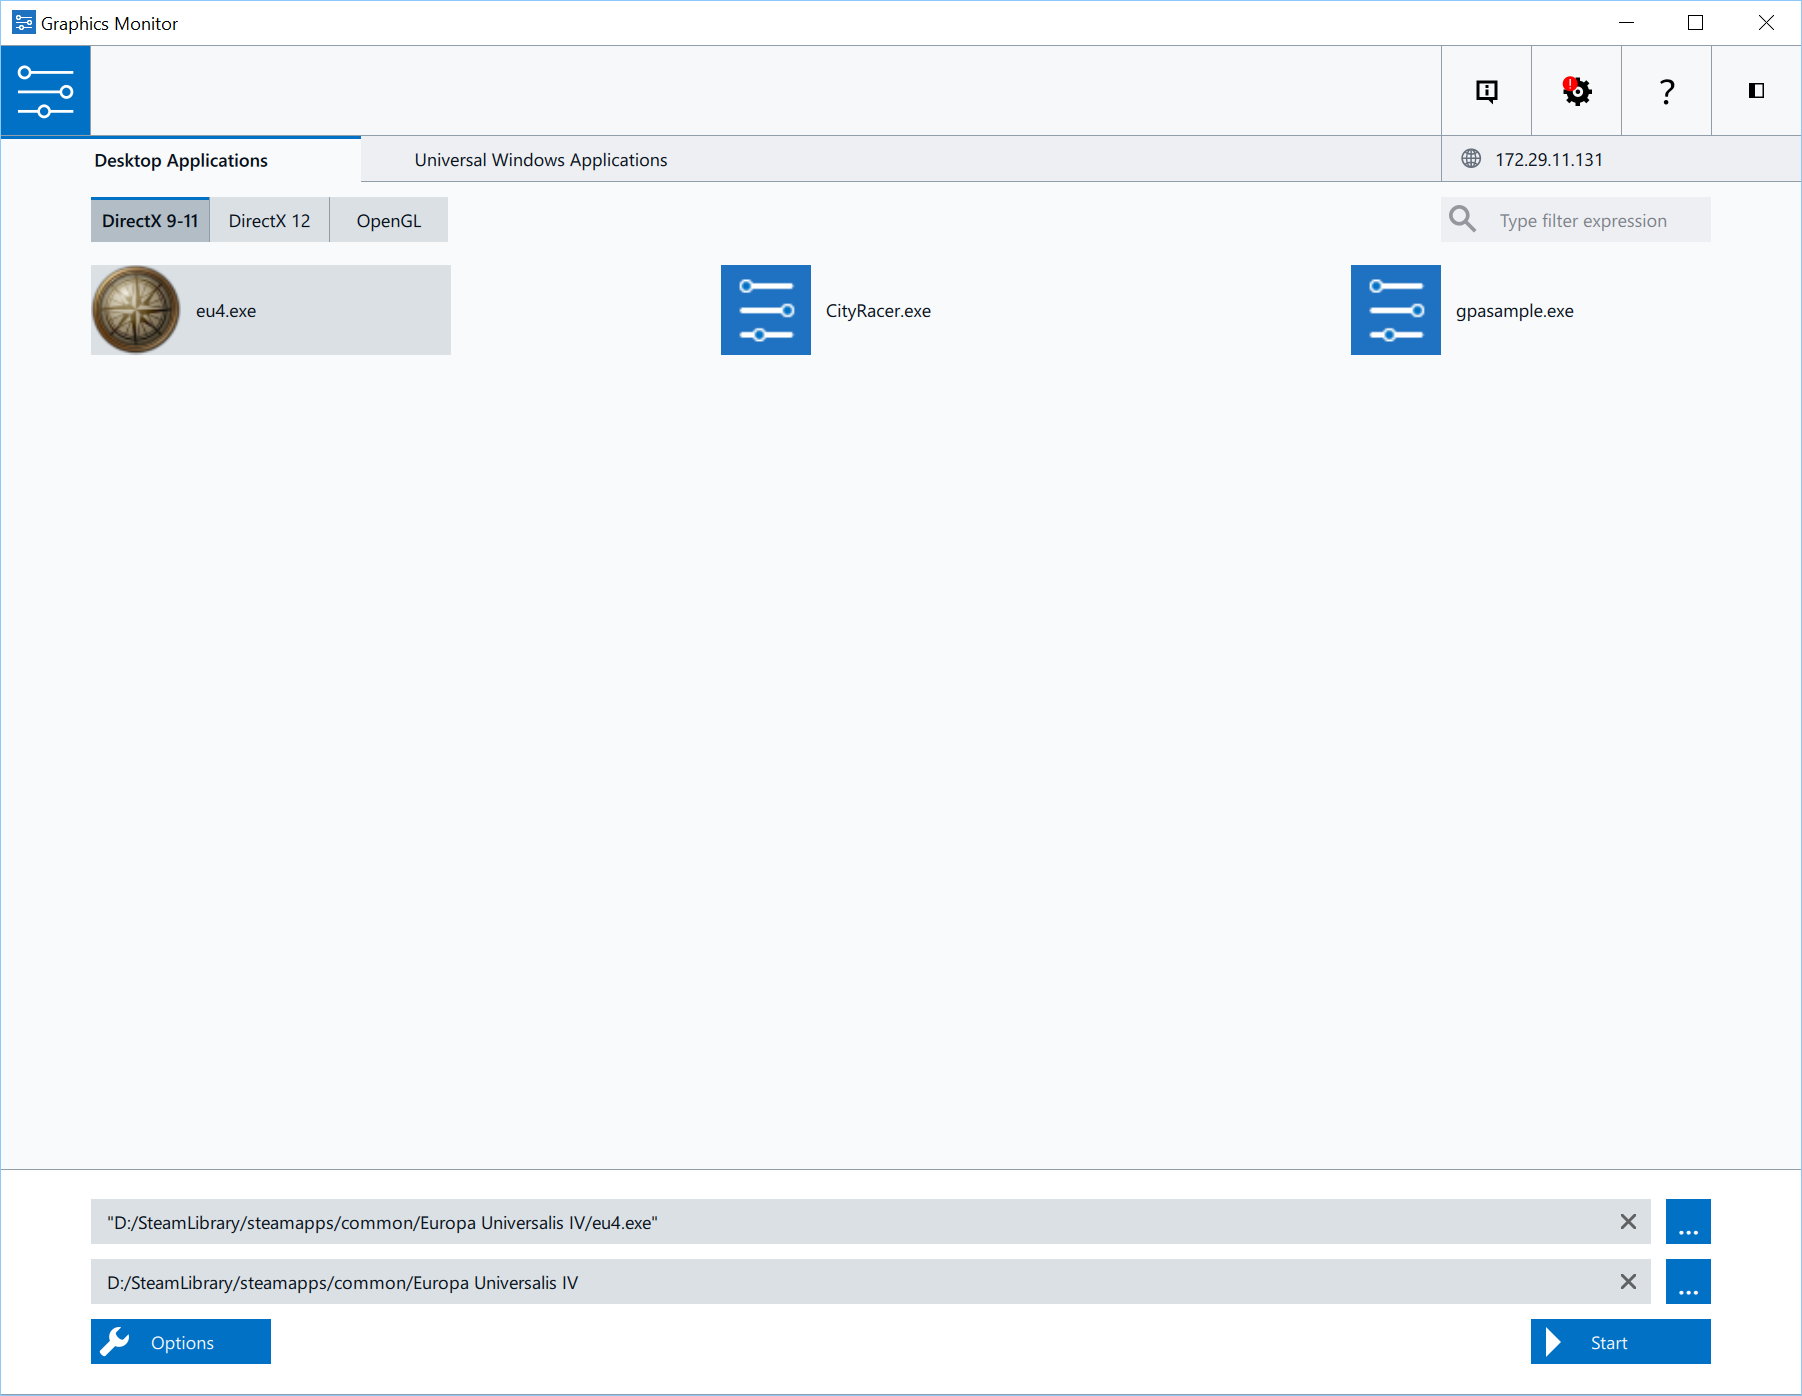
First thing we want to do is use the GPA Graphics Monitor tool to launch EU4 from its directory. This will launch the game with the GPA overlay, giving us real-time performance information and the option to capture frames. In this example I will be running on a NVIDIA 1080 GPU so will be targeting the max settings so that we can see where each option is placed in the pipeline. The settings and overlay can be seen in the screenshot below.
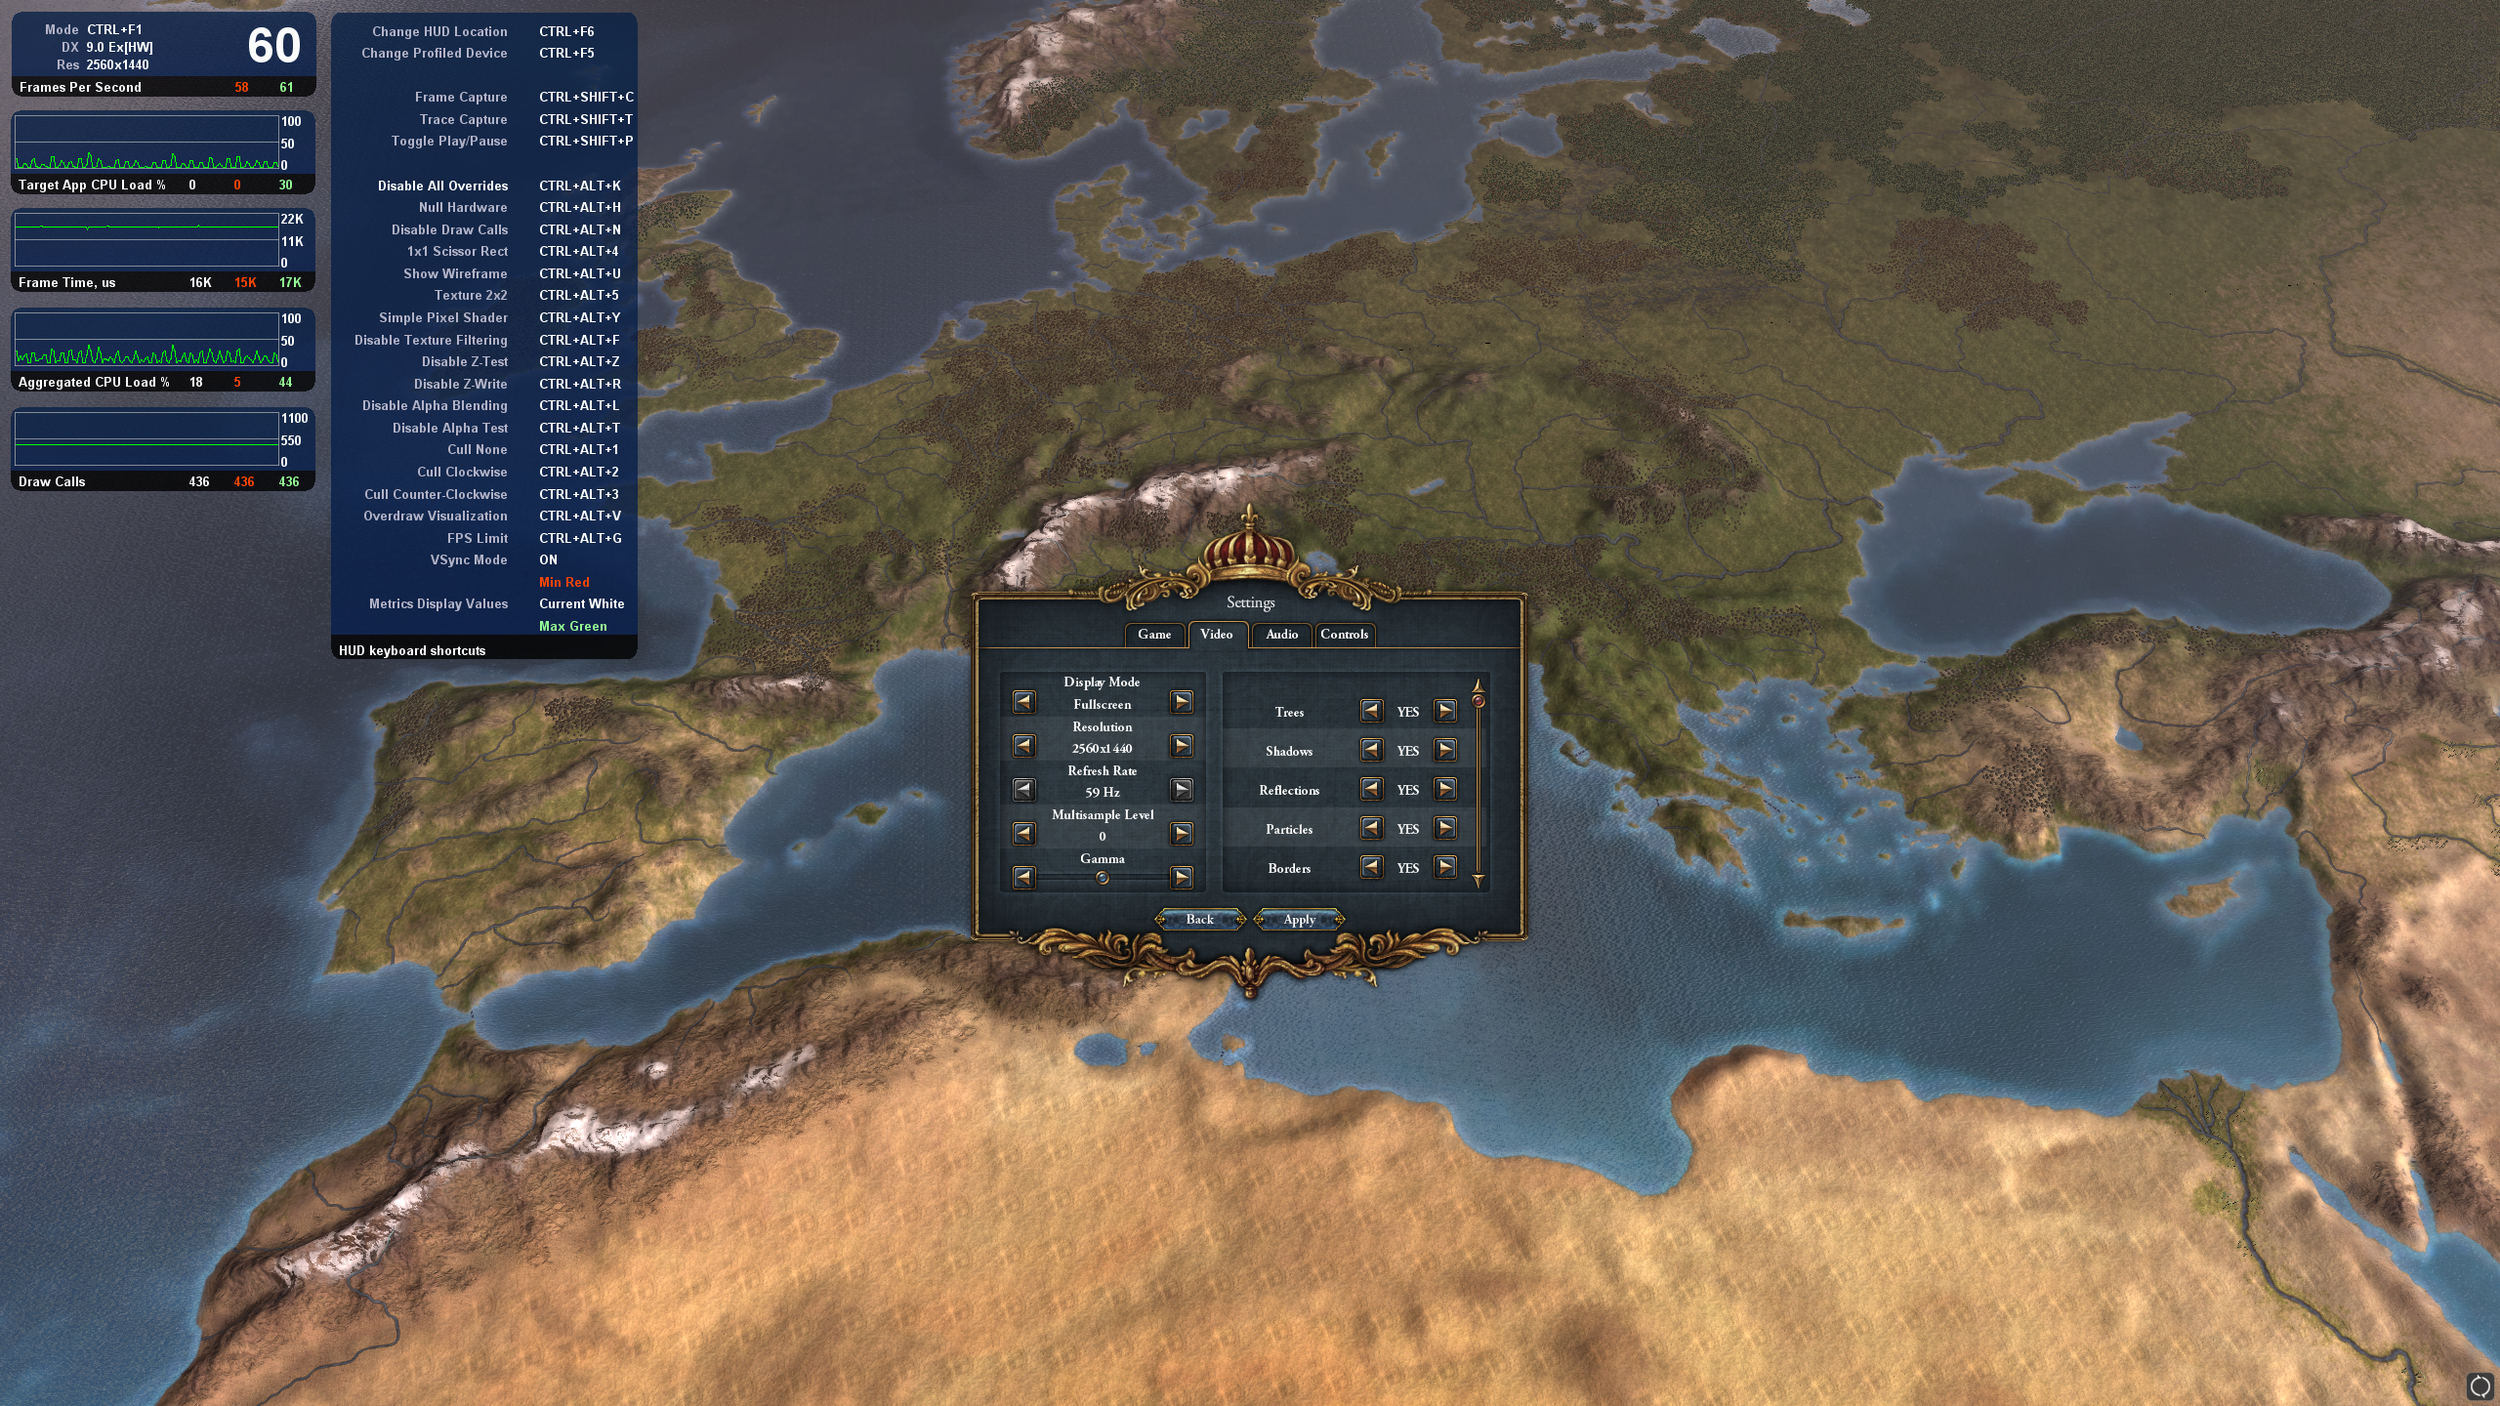
The intention was to run with max settings, but we have had to step down from 4k to 2560x1440 due to the game performance dropping to below 1FPS at the higher resolution while running with Intel GPA (and not good without it either...) . Something that will be covered later.
With the settings covered and GPA running we now need to take some frame captures. As this game has a relatively simple view, we will be taking a capture close to the ground, mid-zoom out and full zoom-out to get a full coverage of the some of the most common cases.
This is performed by pressing Ctrl+Shift+C when the game is in the right position. An important note when capturing is to take note of the CPU usage. This data is not always captured with the frame and can indicate if there is a CPU bottleneck which may be causing poor GPU performance. In the case of our capture (below) we arent using very much CPU at all so that should not impact the results much here.

In my captures I have used a save file from a playthrough with a random 'new world'. This is due to my own interest in seeing if the randomly generated terrain is handled differently than the standard world map geometry.
Once the three captures have been taken, open Intels Graphics Frame Analyser tool where the captures should be displayed.

We can start by opening the zoomed-out capture first, as this has the least detail and should give use the broad strokes of the rendering process. This will give you a view of the data like this:

The important things to look at here are the top timeline and the view frame at the bottom left. The timeline on the top will allow you to set the x and y axis to be the GPU duration to highlight particularly expensive calls and the view on the bottom will highlight what is being rendered on each render target for each of the calls in the timeline.

As an example I selected the group of similar draw calls (ID=~1000 to ~10400) which is appears to handle only the drawing of the borders in of the world and this is shown in the bottom frame with a pink highlight of the pixels which are being rendered to. Above that there is information on my selection. It says that we selected 9483 draw calls which account for 90.1%(!!!) of the total rendering time for the frame! Scary, but we will get to that in the section on how to improve this pipeline. For now this is just to show you how this tool works.
We will use this approach to see how the scene is rendered by stepping through the draw calls and seeing what they are doing. From what we can gather the process for drawing the world appears to be starting with the zoomed out capture:
Zoomed-out capture analysis

With the numbers referring to the GPU instruction ID

The timeline is broken up by some taller commands, there are the buffer copies which nicely split the pipeline into the four coloured sections shown in the diagram. The length of each section is not entirely representative of the total rendering time but is an indicator that something isn't as ideal as it could be in this particular pipeline.
Overall the pipeline is relatively simple (by modern standards). It uses a depth map for correctly layering objects in the scene and each stage of pipeline ties nicely into the options from the settings. With the exception of shadows which appear to be disabled or not rendering at this level of zoom.
From a graphics programmers view, there is a number of very interestingly strange things going on with the way objects are submitted for drawing in this pipeline.
For starters the sheer number of draw calls is ridiculously large for even a major AAA game and this leads to a bottleneck in the gpu as each of the submitted draw calls are relatively tiny with only tens of primitives at the best of times. This is shown, rather crudely, in GPA by the occupancy and thread dispatch boxes showing red for the frame.
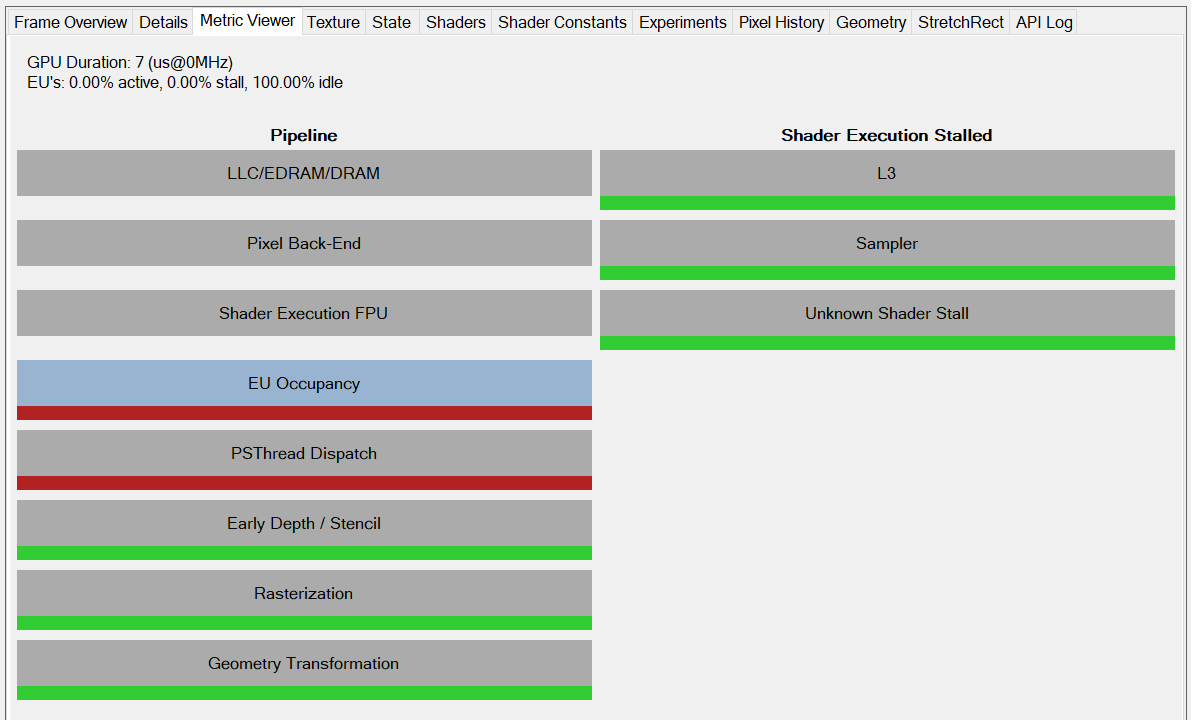
This is starving the GPU. For a lot of these calls the GPU is probably spending more time in the driver than it is actually processing the data it is being given. This is particularly noticed when the game is rendering borders, state names, rivers and trees.
The terrain is also interesting. The world is rendered as 36, 8196-triangle grids. Essentially one big height map broken into chunks, which reads its lighting from the precomputed base texture in the setup stage. 8196-triangles is a relatively insignificant amount of triangles to draw and each of the 36 grids appears to share the same texture and shader state. There doesn't appear to be an apparent reason this is separated instead of being one giant geometry. If the reason is LOD (level of detail) related this could be resolved CPU side very cheaply to select and combine multiple vertex buffers or vertex buffer sections into one call.
There is a lot of other details but they appear to be the same throughout all captures, so I will address them in the optimisation section at the end.
Close Capture Analysis

As suspected,. the shadows showed up in the close zoom levels. In the zoomed out pipeline map there was some strange depth maps being cleared and appeared not to be used later in the pipeline. When we have a closer view these render targets become used for storing and processing the shadow map that is produced in the setup stages, the shaders being used later in the pipeline are also binding this as a texture and appear to be using it - the rest of the pipeline remains unchanged in my casual exploration.

The borders, text and UI remain as the main culprit of GPU use, but with the additional of a lot of calls rendering the scene objects for the shadow map and processing adding some extra work.
This is offset by some good culling of the terrain. In the far out LOD the entire terrain and water were rendered as many chunks together. At this level, the fewer chunks reduces the total number of draw calls submitted, but the culling was not correct and some out of view chunks were submitted.

Mid-Zoom Capture
Our mid-level capture appears to have the same pattern as the far-out zoom. All the city, unit detail and shadow is LOD'ed out, leaving only the map rendering. The gives us the same behaviour with less of the draw-calls as less is visible. Rendering borders still covers the majority of the calls, but it isnt as dramatic as the far out zoom.

We can see in this image that the depth buffers used for the shadow map are still bound and cleared each frame (RT2-5) and are apparently unused, but I may have missed something.
Sins of a Render Empire
So in the last three sections I gave an overview of the pipeline and how it changes in different configurations - essentially some features are disabled as LOD features based on distance. However, this isnt the only place to look when we are considering performance. So in this section we are going to cover a few oddities that need addressing if this game was going to be optimised.
4k Support
As I mentioned in the setup for this, I intended to run this on max setting at 4k resolution. This currently isn't possible with a high-end intel chip and NVidia 1080 - a little strange for a game from 2013.
The game runs roughly fine at 4k when we dont enable all the on-off options in the video menu. A quick investigation into this and it seemed that the shadows really take most the time. A problematic quirk of resolutions is that when we double the size we quadruple the number pixels (which also quadruples the amount of work). In this engine, the shadow buffers appear to be sized based on the full rendering resolution. So, going from 1440p to 4k doesnt just quadruple the cost of rendering the scene, it has to be rendered twice at that size, so it is a ~8x increase in rendering cost.
Additionally the trees are expensive at 4k. This is a relatively simple reason, at 4k we see more pixels on each tree. Each tree has high texture detail and for some reason a detailed normal map. So now we have also quadrupled the texture read cost, with little coherency because the trees are small and dense and the texture resolution is reasonably high.
Water is similarly effected, but not as much as the trees due to similarity in the pixel space helping cache coherency.
In the game there are a number of what appear to be generated textures, the size of these appears to be loosely based on the resolution that is being used. However, they do not stick to power of two texture sizes. So a texture that is 1029x1029 is actually a 2048x2048 texture under the hood on certain hardware, this doesnt effect the appearance of the texture but does have performance implications and is just a massive waste of memory.
This next complaint is just because I play this game a lot. At 4k the menus get really tiny and that's a pain.
DirectX 9.0c
This game is written with DirectX 9.0c. In 2013 when this came out, DirectX 10 and 11 had long been a standard and DirectX 12 was well on the way as well as AMD's early experiments with Mantle which led to Vulkan.
AMD and NVIDIA put a lot of work into optimising drivers for modern hardware. This focus is obviously for patterns and use-cases in common software. DirectX 9.0c misses a lot of features that could really make this type of game fly on even a basic laptop.
Overbinding and draw calls
Textures are bound each time they are used. Tiny objects are submitted to draw calls. There is either a massive lack of batching or it is not apparent in the capture.
This puts the game at the mercy of the PCI-bus and the drivers. Every time you ask the GPU to do something you risk a major state change stalling the next draw. So much of the textures being bound are identical (outside of the UI) and there is a lot of texture slots to bind, some textures are so low resolution they may as well be constant buffers and allow for some nice out of order operations to be able to be done.
Texture Space Wastage
The cubemap for the sea is a good example of this. Due to the angle of the camera only a limited section of the cubemap will be accessed, so half of the cube map is just blank. This is more likely a trade-off than an error as the DX9 cubemaps have some strange rules - but it isn't ideal in a modern game.

Conclusion
From this we have shown how to analyse a game through frame capture. Shown how to extract the pattern it uses for rendering and view the content of each rendering step. We then covered what could be causing some of the performance hiccups we see during gameplay and how they could be fixed.
I would like to add the captures frames to this post but I think that might count as distributing content from the game and I am not sure of the legality of that, so for now I hope my instructions on how to set this up on your own system with your own copy of the game is enough!